2026-08-14
Semantic Monte Carlo
Alberto Sánchez, Carlos Pujades, Fernando Rodriguez
Abstract
Current internet search agents perform well on determinate numerical questions whose answers already exist in published sources, but are less useful for non-determinate questions whose correct values are unknown. We introduce Semantic Monte Carlo, which generates paraphrased variants of a numerical question, queries them with multiple search agents, and combines their answers using confidence-weighted bootstrapping. This produces a distribution over plausible values rather than a single estimate.
To evaluate non-determinate questions, we introduce a confidence-calibration benchmark measuring absolute error between expected and estimated confidence. On an 80-row benchmark split, Semantic Monte Carlo achieves a mean absolute confidence error of 0.288, with stronger calibration at the extremes: 0.084 error at 95% expected confidence and 0.155 at 5%, compared with 0.492 at 35%.
Architecture
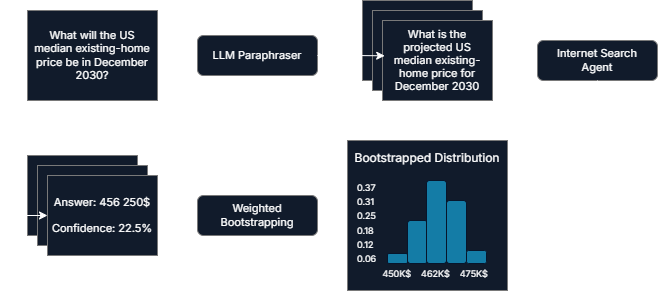
- We first take the input question.
- We use an LLM to paraphrase the question into variants. The goal is to preserve the underlying question while changing its phrasing to trigger different searches from different sources.
- We send each question variant to internet search agents. We also vary the agent used (deepseek native search, Exa API, Firecrawl, Parallel, Perplexity) to introduce additional diversity in retrieval and source selection.
- We get the estimated numerical answer and the confidence in the cited sources (leaving an option for the LLM to not answer).
- We then aggregate the resulting numerical estimates using confidence-weighted bootstrapping. The final output is a probability distribution over plausible numerical answers. If the searches strongly converge, the final distribution becomes concentrated. If they disagree or retrieve a large number of non-answers, the distribution becomes more spread.
Benchmarking Impossible Questions
For determinate questions, evaluation is straightforward: the method's prediction can be compared against a known ground-truth answer, and several existing benchmarks already cover this setting (e.g. SimpleQA, TriviaQA). The main value of our method, however, lies in estimating non-determinate questions, where the answer is unknown. We therefore want these questions to be a central part of the benchmark. The difficulty is that, by definition, they cannot be assigned reliable target answers at evaluation time.
Because of that, we propose a different benchmarking method. Instead of defining a target answer for each question, we define a target confidence.
Determinate, well-known questions such as: "What was Apple's total revenue in the last fiscal quarter?" should have a very high target confidence. Non-determinate or highly uncertain questions such as "How many gold medals will the leading country win at the 2040 Summer Olympics?" should instead have a very low target confidence.
Thus, rather than evaluating whether the method predicts an unknowable answer correctly, we evaluate how well calibrated the method is about the uncertainty of its answer.
Based on this idea, we created a benchmark containing 300 questions, each with a corresponding expected confidence and domain. We include the domain because it likely has an impact on confidence: some domains are inherently more predictable than others.
The Metric
The proposed metric to measure confidence in our bootstrapped distributions is a variation of normalized variance. It measures how concentrated the numeric probability mass is relative to a uniform distribution, and then scales that score by the probability of obtaining a numeric answer.
- : distribution confidence score (bounded to ).
- : normalized probability that a search returns a numeric answer.
- : each unique numeric answer.
- : normalized probability assigned to .
- : probability-weighted mean of the numeric answers.
- : ordinary mean of the unique numeric answers.
- : number of unique numeric answers.
Intuitively, if the different searches produce answers concentrated around the same value, the distribution receives a higher confidence. If they produce very different values or non-answers, confidence decreases.
We then define our main benchmark metric as the absolute difference between the method confidence and the expected confidence assigned to each question:
Here, a lower score indicates better calibration of our distribution.
Hyperparameter Search
One of the most critical hyperparameters to optimize for this method is the number of paraphrases —and therefore consecutive searches— that we perform.
In practice, this defines the tradeoff between cost and performance: more searches require more token spending, but also provide more datapoints to refine the final distribution.
For the hyperparameter search, we evaluate the absolute difference between expected and calculated confidence over a 20-row split of our dataset with a search over .
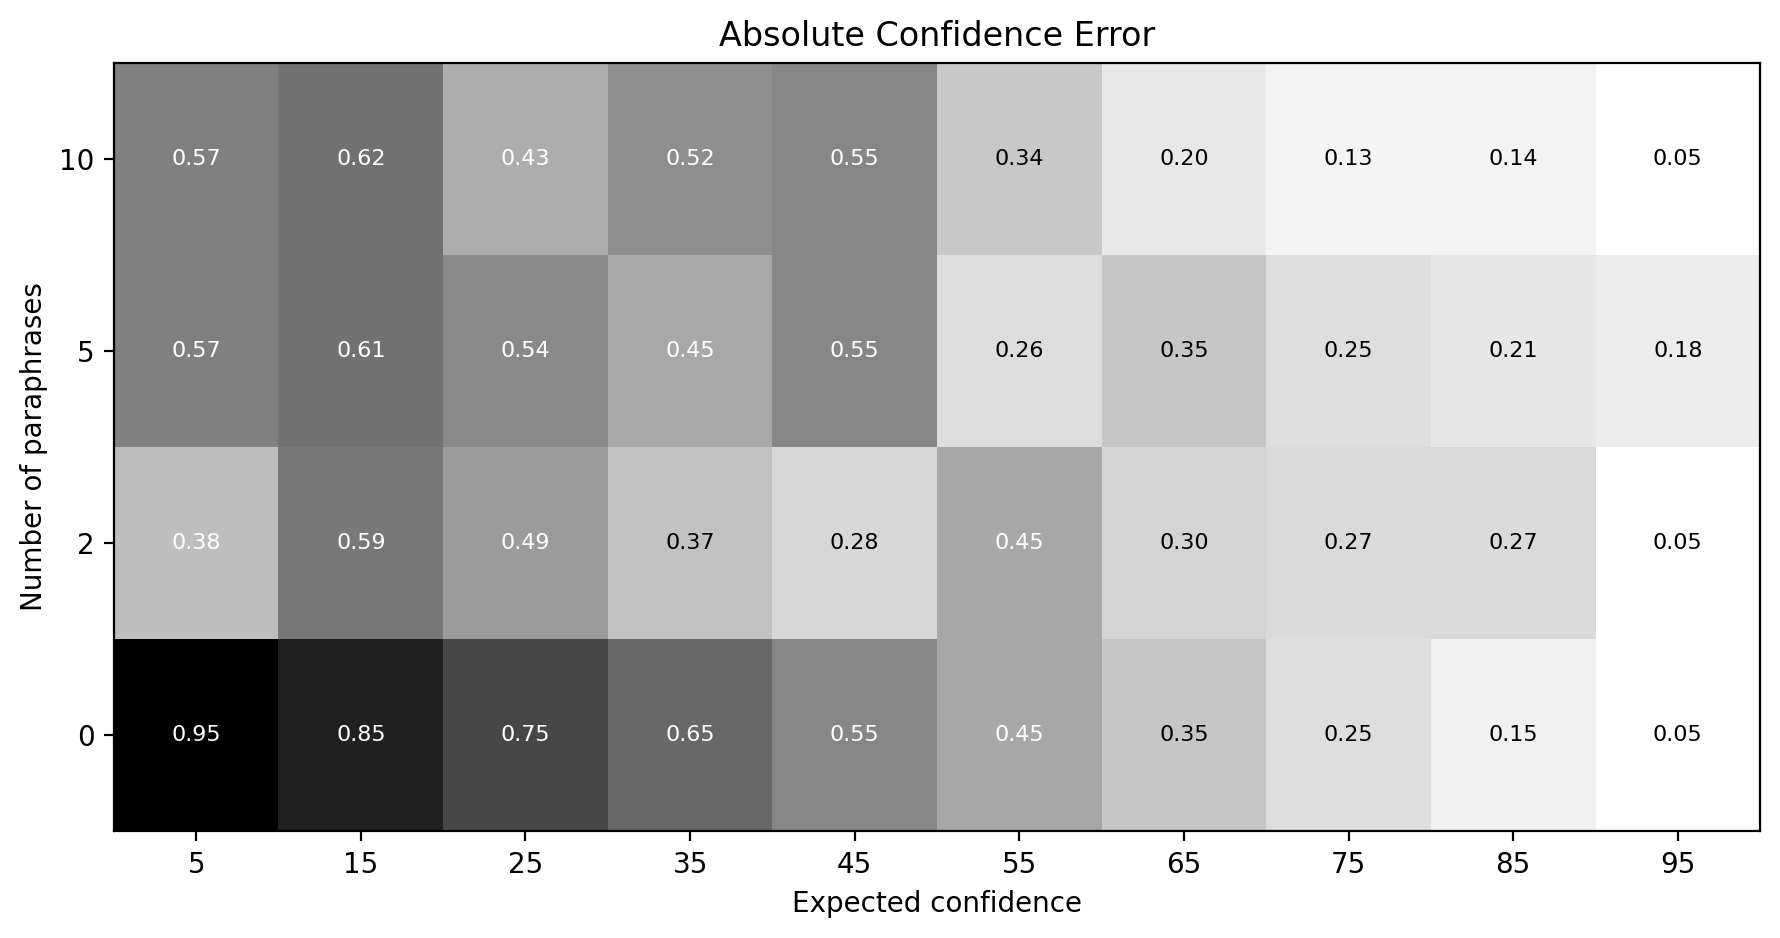
We can see that, except in the extreme case of 0 paraphrases, which shows clear degradation, there is not a large amount of variability across this hyperparameter. However, with 5 or more paraphrases, we see better performance on questions with high expected confidence (>50%). Meanwhile, with only 2 paraphrases, we see better overall performance on questions with lower expected confidence.
Our interpretation is that additional searches are more useful when there is a real underlying answer for the agents to converge toward, while on highly uncertain questions additional searches may introduce correlated evidence or artificial agreement.
Because of this, we use 3 paraphrases as a practical tradeoff between cost, search diversity, and performance.
Final Benchmark
After finding an optimum number of paraphrases (3, as we previously discussed), we run our method on an 80-row split of our benchmark.
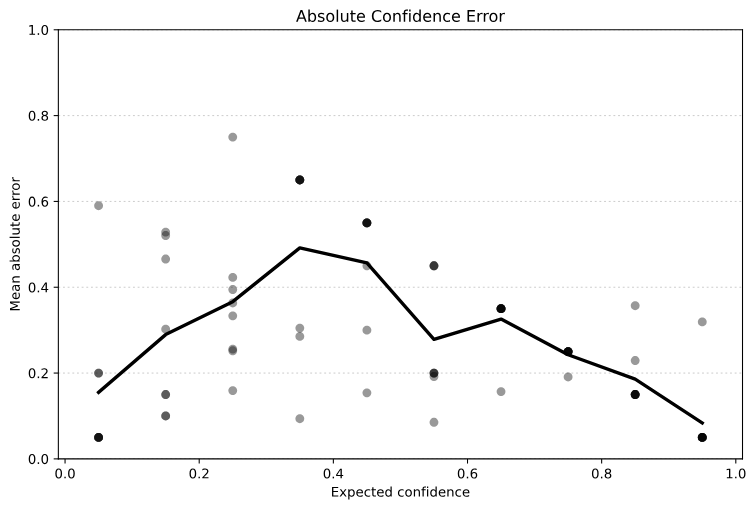
The method appears to recover a meaningful confidence signal.
Confidence aligns with the expected confidence particularly well at the extremes: really hard to answer and really easy to answer questions. The middle of the range shows less calibration. These are questions where some useful evidence exists, but where the answer is still uncertain enough that different searches can reasonably disagree.
Even in these medium-confidence regions, however, the mean absolute confidence error generally remains below roughly . This is still far from perfect calibration, but it suggests that disagreement across search trajectories contains useful information about the underlying uncertainty of the question.
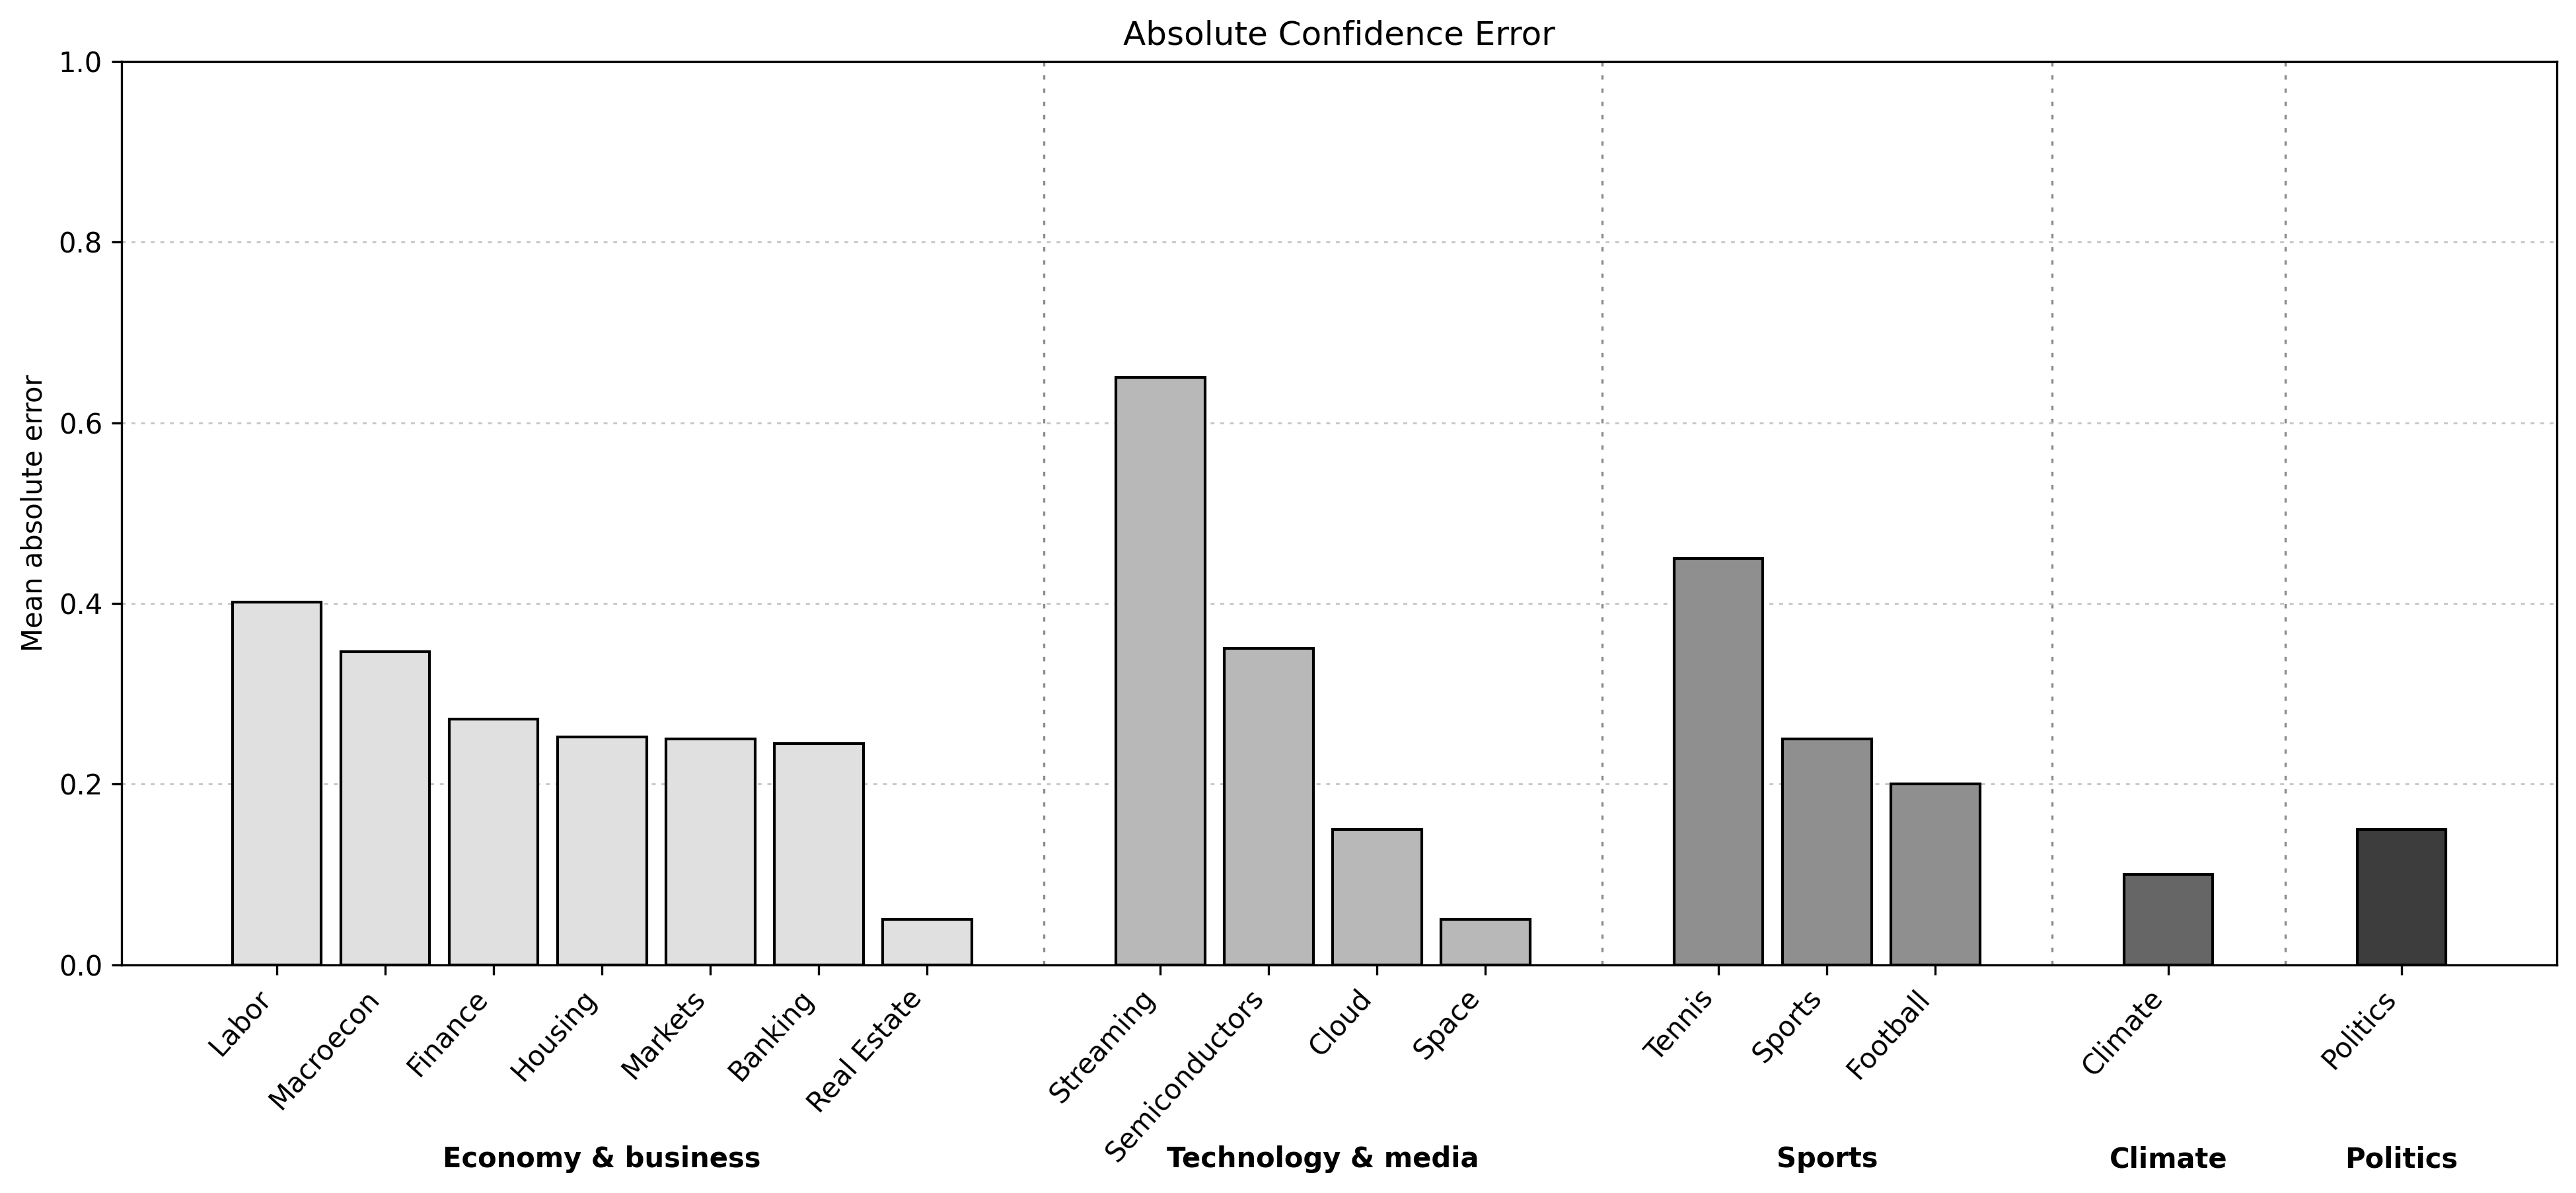
A finer-grained look shows that performance varies considerably across domains.
For example, within economy and business, labor and macroeconomic questions appear substantially harder than real-estate questions. Technology and media also show significant variation: streaming questions have particularly high confidence error, while cloud and space questions perform much better.
This suggests that calibration is not only a property of the method. It also depends on the information environment of each domain: how much relevant information exists, how correlated the available sources are, how predictable the underlying process is, and how much disagreement exists between reasonable forecasts.
Limitations
There are several important limitations to the current method. The samples are not truly independent, since different paraphrases and search agents may retrieve the same sources or rely on shared underlying data, making the resulting distribution appear more confident than the evidence warrants. The confidence metric is also heuristic: low variance can reflect correlated agreement rather than correctness. Finally, the benchmark’s expected-confidence labels are subjective approximations of uncertainty rather than objective ground truth and are relatively small due to budget constraints.
Future Research Lines
The current version of Semantic Monte Carlo shows some good results but still can be improved and used for new use cases. We here show some directions we can explore in the future for improving both the quality of the distributions and their usefulness in downstream models.
- Use Semantic Monte Carlo for other models such as Bayesian Networks (as priors) or Time-Series Models (as exogenous variables).
- Reduce the overall cost by fine-tuning smaller models, adjusting the number of searches so easier questions don't need to sample that much.
- Measure correlation across sources to better refine the resulting distribution and avoid treating correlated sources as independent evidence.
- Use Semantic Monte Carlo to estimate unknown parameters for mathematical models (e.g. financial, demographic, or population models).