 PyLIMID
 is a Python library for building and solving limited-memory influence diagrams. Chance nodes can be discrete, continuous, or both in the same model. Combine them with decisions and utility functions, then fit policies to maximize expected utility.
Installation
Install PyLIMID with the following command in a Python 3.12 environment. The default installation uses the CPU. To run on an NVIDIA GPU on Linux, follow the CUDA installation instructions .
pip install pylimidFeatures
Flexible distributions
Combine discrete and continuous chance nodes in one model. Describe uncertainty with NumPyro distributions whose parameters depend on their parents.
dist.Gamma(concentration=4.0, rate=4.0 / mean)Bayesian priors
Express uncertainty about the model itself. Give unknown parameters prior distributions, then update beliefs from observations.
dist.LogNormal(loc, scale)Utilities as functions
Write utilities with JAX. Express costs, thresholds, nonlinear returns, and risk preferences directly as functions of the model's variables.
revenue - stock_cost - promotion_costDiscrete and continuous decisions
Choose between named actions or a scalar quantity. Policy gradients jointly fit the decision rules within the policy families you declare.
TabularSoftmax() · DistributionPolicy(...)

Built on top of NumPyro and JAX
Example: promotion and stock decisions
This example models an ice cream shop that chooses whether to run a promotion and how much stock to order. Each kilogram costs $10 and sells for $100, and anything left at closing is thrown away.
The owner has daily sales records and a weather log. From them, the shop estimates a 0.7 probability of a cloudy day and a 0.3 probability of a sunny day, with mean demand of 4 kg on cloudy days and 12 kg on sunny days.
Demand is modeled as a Gamma distribution with concentration 4.0 and rate 4.0 / mean. The concentration gives a coefficient of variation of 0.5. A $60 promotion is expected to raise mean demand by 20%.
The owner announces the promotion the evening before, when tomorrow’s weather is still unknown. In the morning, the owner checks the weather and decides how much to order, remembering whether the promotion is running. The freezer holds up to 40 kg.
The problem can be modeled with the following influence diagram.
The shop is a small example. The same node types and policy families apply to other sequential decisions where the available information and objective can be written down.
Define uncertainty and profit
Demand follows a Gamma distribution whose mean depends on weather and promotion. Profit is revenue from what sells, minus stock and promotion costs.
import jax.numpy as jnp
import numpyro.distributions as dist

from pylimid import (
    ChanceNode,
    DecisionNode,
    DistributionPolicy,
    InfluenceDiagram,
    Interval,
    Linear,
    TabularSoftmax,
    UtilityNode,
    solve,
)

COST = 10.0
PRICE = 100.0
CAPACITY = 40.0
PROMOTION_COST = 60.0
PROMOTION_BOOST = jnp.array([1.0, 1.2])
WEATHER_STATES = ("cloudy", "sunny")
WEATHER_PROBS = jnp.array([0.7, 0.3])
DEMAND_MEANS = jnp.array([4.0, 12.0])def demand_dist(weather, promotion):
mean = DEMAND_MEANS[weather] * PROMOTION_BOOST[promotion]
return dist.Gamma(concentration=4.0, rate=4.0 / mean)
def profit(order, demand, promotion):
revenue = PRICE * jnp.minimum(order, demand)
return revenue - COST * order - PROMOTION_COST * promotionBuild the influence diagram
Add the five nodes and connect their dependencies. The promotion chooses between two actions. The order chooses a quantity between 0 and 40 kilograms.
diagram = InfluenceDiagram()
diagram.add_node(
    ChanceNode(
        name="weather",
        states=WEATHER_STATES,
        dist=lambda: dist.Categorical(probs=WEATHER_PROBS),
    )
)
diagram.add_node(
    DecisionNode(
        name="promotion",
        states=("skip", "run"),
        policy_family=TabularSoftmax(),
    )
)
diagram.add_node(
    ChanceNode(name="demand", parents=("weather", "promotion"), dist=demand_dist)
)
diagram.add_node(
    DecisionNode(
        name="order",
        parents=("weather", "promotion"),
        action_space=Interval(0.0, CAPACITY),
        policy_family=DistributionPolicy(
            distribution=dist.TruncatedNormal,
            parameter_model=Linear(outputs=("loc",)),
            fixed_parameters={"low": 0.0, "high": CAPACITY, "scale": 0.25},
        ),
    )
)
diagram.add_node(
    UtilityNode(name="profit", parents=("order", "demand", "promotion"), values=profit)
)
Fit the policies
Fit both policies together, then inspect their estimated expected utility.
solution = solve(diagram, num_steps=2_000)
print(solution.render())
Fitted policies
In this quickstart run, the fitted promotion policy puts more than 99.9% probability on running the promotion. When it runs, mean orders are about 7.2 kg on cloudy days and 21.0 kg on sunny days.
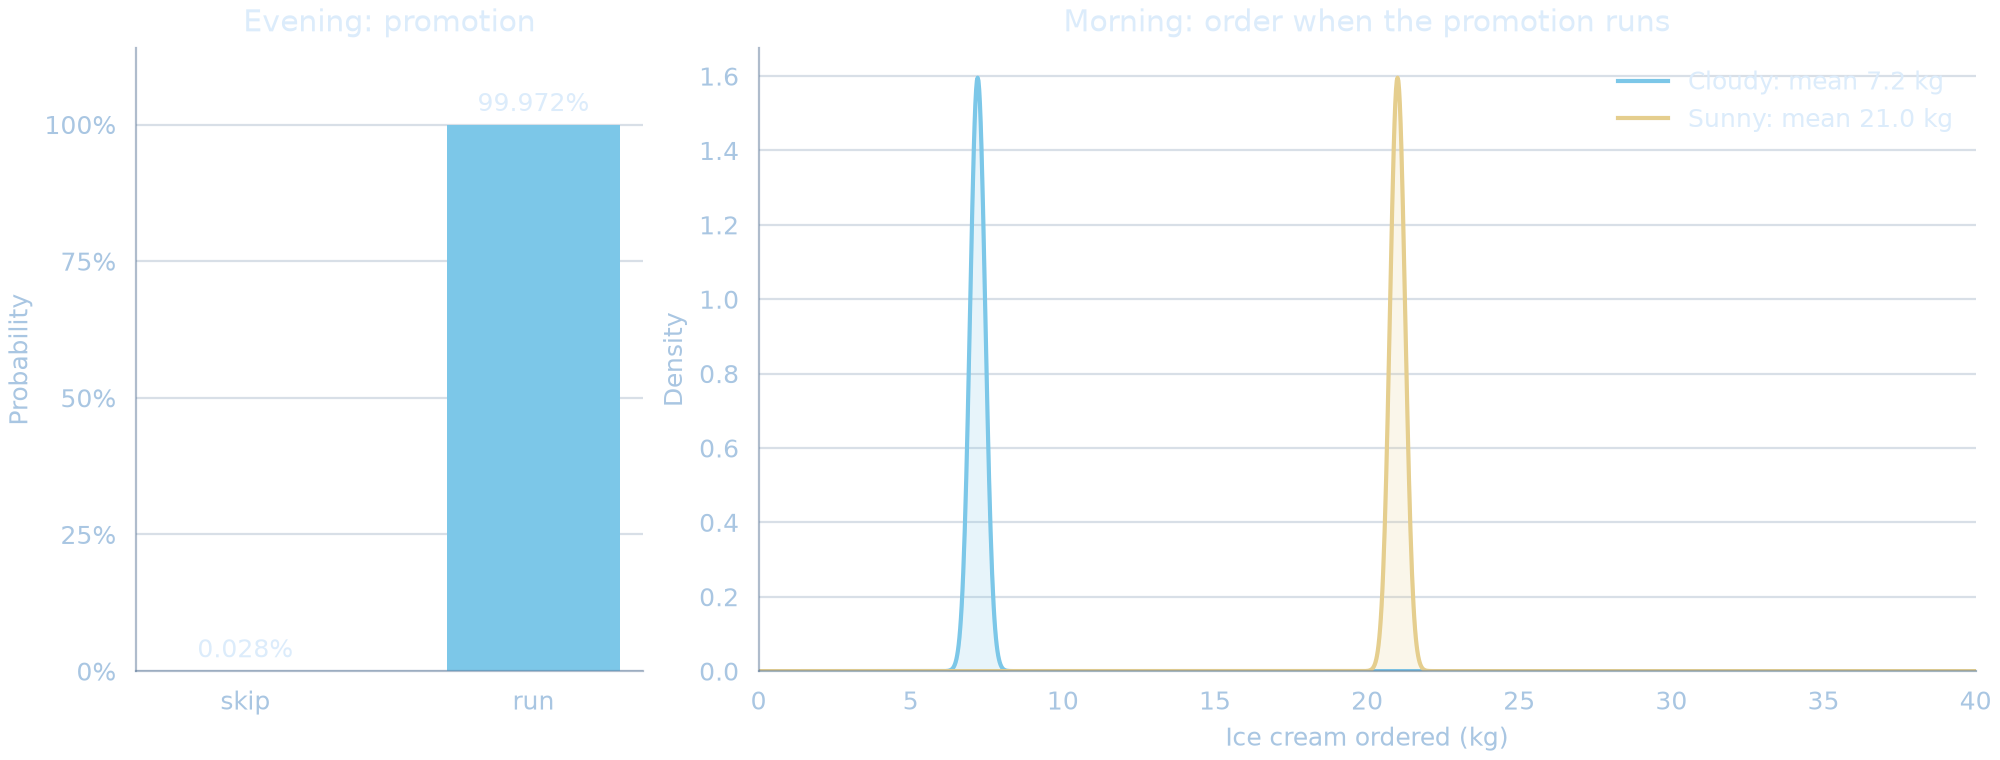
The estimated expected profit is about $542.6 per day. Both fitted policies remain stochastic. Results are approximate, and training does not guarantee the optimal policy.
Continue this example and explore more in the documentation, where the next step adds a Bayesian prior for a busier seasonDocumentation
Open source under the Apache 2.0 license.